Pie charts are a great way to show how different parts make up a whole. They’re often used to show data, like how much of something there is or how it’s divided up. We have short video explaining pie charts.
Today, we’re going to learn about fractions and how they can be used to create a pie chart.

What is a fraction?
A fraction is a way to show how much of something there is compared to the whole. For example, if you have a pizza and you eat half of it, you can say that you’ve eaten 1/2 of the pizza.
Now let’s create a pie chart using fractions. Let’s say we have a class of 20 students and we want to show how many of them like different types of pizza. We surveyed the class and found out that 8 students like pepperoni, 7 students like pineapple, and 5 students like cheese. To create a pie chart, we’ll use fractions to show how much of the class likes each type of pizza.
| Pizza | N of Students |
| Pepperoni Pizza | 8 |
| Pineapple Pizza | 7 |
| Cheese Pizza | 5 |
20 is the whole since we have a total of 20 students in the class.
Next, we’ll use the fractions to show how much of the class likes each type of pizza.
To do this, we will do some math calculations to find out what fraction of the whole is each number in our table. And to do this we need to know about “common factors”.
What is a common factor?
“Factors” are numbers we can multiply together to get another number.
When we find the factors of two or more numbers, and then find some factors are the same (“common”), then they are the “common factors”.
8 students / 20 students = 8/20 = 2/5 of all students like pepperoni pizza.
*common factor is 4 and we divide both numbers by 4
7/20 of all students like pineapple pizza.
*7/20 as a fraction cannot be simplified as a fraction since 7 and 20 do not have a common factor
5/20 = 1/5 of all students like cheese pizza.
*common factor is 5 and we divide both number by 5
Now we can use these fractions to create a pie chart.
We can use Excel or Google Sheets to create a pie chart from our table

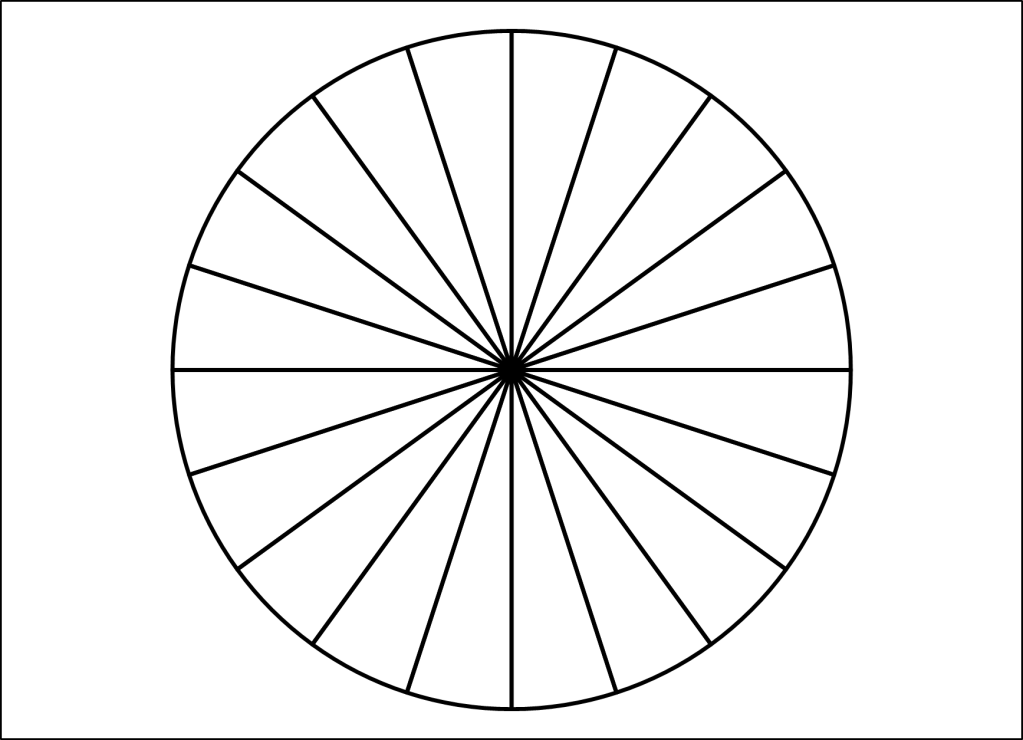
To make it even more fun we can draw a circle, devide it into 20 equal parts and color blue 8 parts for pepperoni, 7 parts in green for pineapple and 5 parts in dark for cheese.
You can download the circle below to help you with this excericise

Now you know how to use fractions to create a pie chart. You can use this method to show data in a fun and easy-to-understand way. Try creating your own pie chart with your own data.
