Let’s practice making a bar chart.
Your family owns an ice cream truck business. After the first week of opening your business again for the summer you want to understand how many ice creams you are selling each day of the week. This will help you understand how people buy ice cream at the beginng of the week, mid week and during the weekend. Then based on these facts and numbers you can make some decisions about your business.
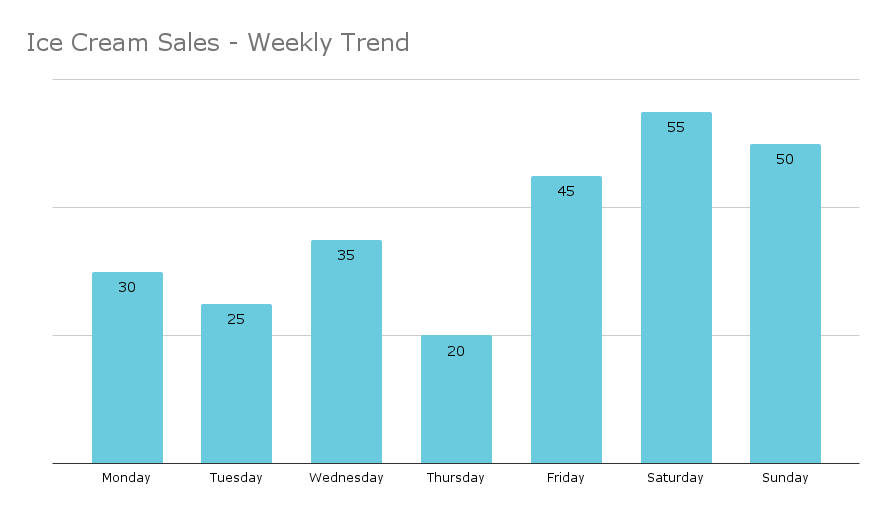
Here is your data for the first week:
| Day of the week | Ice Cream Sales |
| Monday | 30 |
| Tuesday | 25 |
| Wednesday | 35 |
| Thursday | 20 |
| Friday | 45 |
| Saturday | 55 |
| Sunday | 50 |
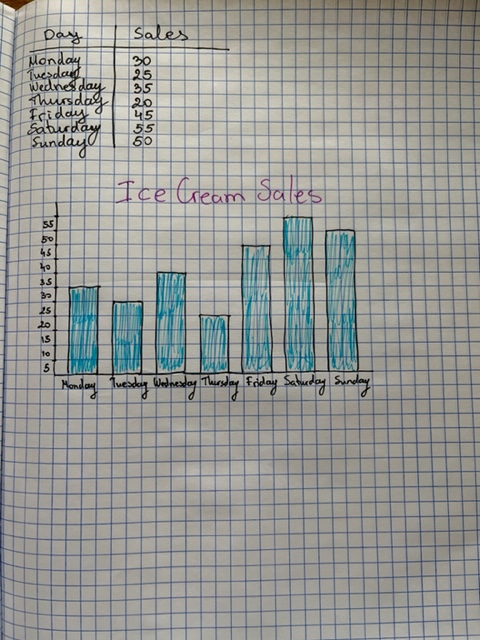
Now let’s use these numbers to create a bar chart.
You can download our Google Sheet and create and style your bar chart there.
Or you can use a graph paper to draw your bar chart.