In this excercise we will create two charts about the weather without using a computer. We will use a graphing paper, pencils and markers.
Graphing paper is great for drawing data. It is devided by horizontal and vertical lines to create little squares across the pages. You can use these squares to measure your labels and axis.
For example in these charts one square measures ten points in our values. But you can choose whatever values you want for your graph.
Here is the finished look of our hand drawn charts. We also created a video for you to follow along to create the charts with us!
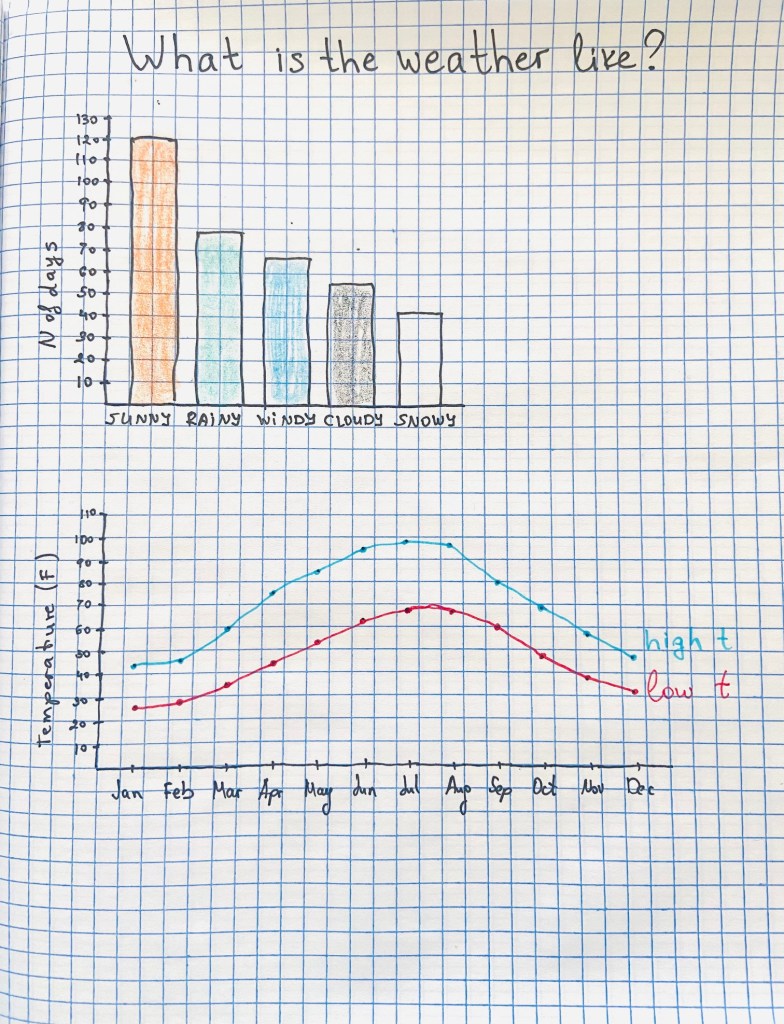
Draw a Bar Chart
Draw a Line Chart
