This excercise teaches you and other kids about the continents in our world. There are seven continents and they are all different in shape, size and people. Some continents are bigger than others and some have more people living in them than others.
In this excercise we are going to build a dual bar chart! Dual bar chart is when our data contains two values (numbers) for one category. Our bar chart will be even more special because one of our values will measure the continent land in sq. kilometers and the other the number of people living in each continent. In cases like this we will use both the left and the right side of our bar chart.
Let’s follow along.
Download our Google Sheet with the data table
As you can see in our data table we have the continents as our category and then the two values, land size and population, for each continent.

Now let’s take a look at the bar chart:
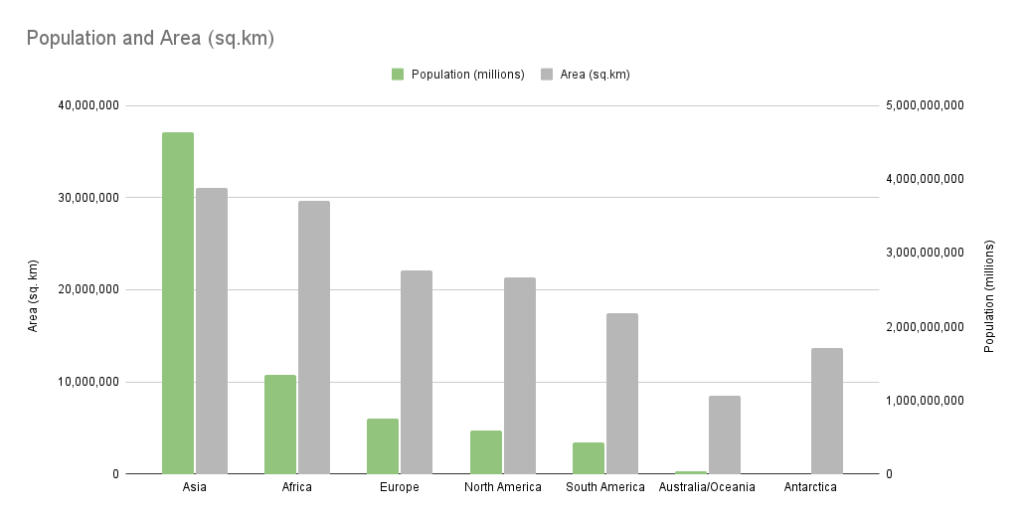
The green bars in our bar chart represent each continent’s population, in other words the number of people living in each continent. The number scale on the right, (also called the right vertical axis) of our chart determines the height of the green bars.
The grey bars in our bar chart represent the continent’s land size. The number scale on the left (also called the left vertical axis) of our chart determines the height of the grey bars.
What can we learn from our data?
- Asia is the biggest continent by size and by population!
- Antarctica has a big land but noobady lives there! Maybe because it is so cold!
Here are several other bar charts to explore and make:
